


It occurred to me yesterday as I was updating documentation for DetectionLab that although it includes a script to install Boss of the SOC, I’ve never actually partipated in it or tried it out. I thought this could be a great place to document how I walk through the series of questions to help other people understand my methodology.
If you’d like to follow along, you can quickly spin up BOTS in DetectionLab as well: https://github.com/clong/DetectionLab/wiki/Install-the-Splunk-Boss-of-the-SOC-(BOTS)-Dataset(s)
The original list of questions can be obtained by emailing Splunk at bots@splunk.com.
For this exercise, I’ve also set up the BOTS Scoreboad Splunk app to check my answers.
(EDIT: You can view questions, but the app isn’t fully compatible with Splunk 8.x)
Hey, don’t spoil the answers for me!
Don’t worry, all of the answers are collapsed by default. Okay, let’s get started!
First, I check the data to make sure it populated in the index correctly:
| tstats count where index=botsv3 by sourcetype (All time)
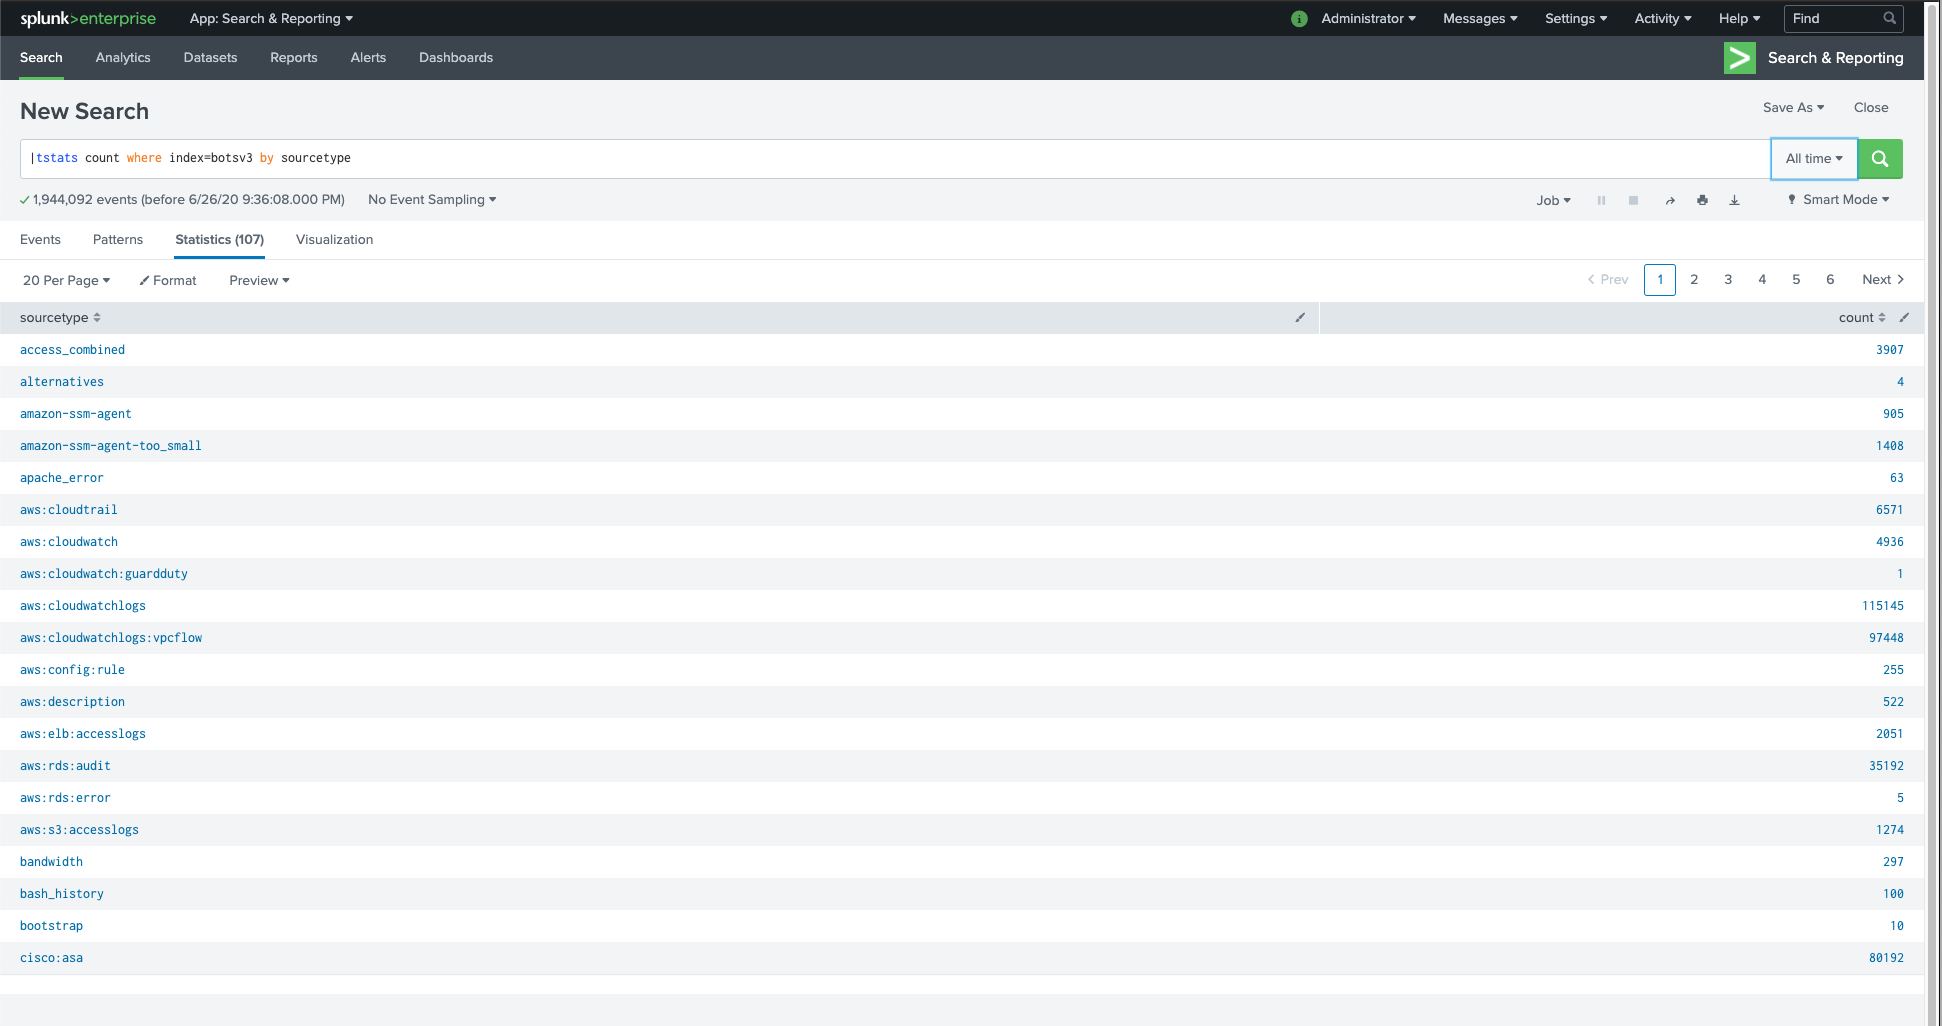
Wow, 107 different sourcetypes - this should be interesting. Onto Question 1.
Question 1 (1)
This is a simple question to get you familiar with submitting answers. What is the name of the company that makes the software that you are using for this competition? Answer guidance: A six-letter word with no punctuation.
Pretty straightforward. Great to check if the scoreboard app is working.
EDIT: Turns out the scoreboard app isn’t compatible with Splunk 8.x yet. There goes that idea. Looks like I’ll just be looking at the .csv for the answers :-/
Question 1 answer:
splunk
Now that that’s cleared up, I think we can move onto question 2.
Question 2 (200)
List out the IAM users that accessed an AWS service (successfully or unsuccessfully) in Frothly’s AWS environment? Answer guidance: Comma separated without spaces, in alphabetical order. (Example: ajackson,mjones,tmiller)
First things first, let’s find the Amazon account number for Frosty’s account. I do some googling to remind me the name of the account number field, which is recipientAccountId in Cloudtrail.
It looks like there’s only one account with an ID of 622676721278 based on this search: index=botsv3 earliest=0 recipientAccountId | stats count by recipientAccountId, sourcetype
Pivoting on that, let’s enumerate all the users. After poking around, it looks like users exist in the “UserIdentity.userName” field. We can use that field (remember it’s case sensitive!) to enumerate user access and get us our answer:
index=botsv3 earliest=0 sourcetype=aws:cloudtrail 622676721278 | stats count by userIdentity.userName
Question 2 answer:
bstoll,btun,splunk_access,web_admin
Question 3 (201)
What field would you use to alert that AWS API activity have occurred without MFA (multi-factor authentication)? Answer guidance: Provide the full JSON path. (Example: iceCream.flavors.traditional)
I don’t know how to look for AWS MFA auth events off the top of my head, so I’ll use Google to help me. Searching cloudtrail mfa 2fa event leads me to this page where I see { $.eventName = "ConsoleLogin" && $.additionalEventData.MFAUsed = "No" }.
I search index=botsv3 earliest=0 sourcetype=aws:cloudtrail mfaused and see additionalEventData.MFAUsed when I expand the event details by clicking the little > button to the left of the event details.
As it turns out, this was a bit of a red herring. There are multiple fields related to MFA authentication and I believe additionalEventData.MFAUsed is only related to console signins. Back to the drawing board.
I broaden my search by including all events containing the string mfa: index=botsv3 earliest=0 sourcetype=aws:cloudtrail *mfa*
After the results come back, I do a ctrl+f on the page and find the answer in the left hand list of field names.
Question 3 answer:
additionalEventData.MFAUsed
Question 4 (202)
What is the processor number used on the web servers? Answer guidance: Include any special characters/punctuation. (Example: The processor number for Intel Core i7-8650U is i7-8650U.)
When I see this question, I immediately think about osquery and the fact that it can collect this information. However, let’s start broad. Intel and AMD are two large processer manufacturers, so lets see what results we get with:
index=botsv3 earliest=0 intel OR amd | stats count by sourcetype
In these results, I see a “hardware” sourcetype, and also an osquery:results sourcetype. Let’s start with my gut feeling first.
index=botsv3 earliest=0 sourcetype=osquery:results intel OR amd | table _time, hostIdentifier, name, columns.cpu_brand
We see two hosts with Intel Xeon processors, but I’m not sure if they’re web servers. I’m going to poke around and see if I can find some relation to hosts and their roles:
index=botsv3 earliest=0 "web server" OR "web_server"
Here we see the following event from a host named hoth: Mon Aug 20 13:33:36 UTC 2018 type=systemctl UNIT=apache2.service, LOADED=loaded, ACTIVE=active, SUB=running, DESCRIPTION=LSB: Apache2 web server
We also see an EC2 image with the description: Frothly's Web Server.
I’m unable to find the exact processor information for hoth, so I try entering the answer for the gacrux hosts and it turns out to be the correct answer. However, it’s not totally clear to me where the gacrux hosts have their roles defined as web servers.
Question 4 answer:
E5-2676
Question 5 (203)
Bud accidentally makes an S3 bucket publicly accessible. What is the event ID of the API call that enabled public access? Answer guidance: Include any special characters/punctuation.
What a great real-life example. Again, I don’t know what specific API call changes S3 bucket permissions, but I’m guessing it has something to do with modifying permissions or attributes, so I’m going to the Googs again.
Also, I don’t know if Bud’s account is bstoll or btun, so figuring that out will help narrow things down. A quick search for index=botsv3 earliest=0 "bud stoll" clears things up immediately.
Searching for Bud’s bucket ACL or policy related activity doesn’t provide any obvious information, as the only two eventNames are GetBucketPolicy and GetBucketAcl. Get events inherently can’t change the policy, so I need to keep digging.
After a bit of searching for things like public-read and coming up short, I decide to just look at all of Bud’s put-related events:
index=botsv3 earliest=0 bstoll eventName=put* | stats count by eventName
Within that search, we can see Bud implement two different bucket ACLs. Review the actual AccessControlList elements and keep an eye out for http://acs.amazonaws.com/groups/global/AllUsers
Remember, the answer to this question is in the eventID field.
Question 5 answer:
ab45689d-69cd-41e7-8705-5350402cf7ac
Question 6 (204)
What is the name of the S3 bucket that was made publicly accessible?
Hopefully you still have the results from question 5 up, because all you need to do is look at the requestParameters.bucketName field.
Question 6 answer:
frothlywebcode
Question 7 (205)
What is the name of the text file that was successfully uploaded into the S3 bucket while it was publicly accessible? Answer guidance: Provide just the file name and extension, not the full path. (Example: filename.docx instead of /mylogs/web/filename.docx)
Well, we know the name of the bucket, and we know the time that the bucket became public, and we also know that it’s a text file. Let’s craft a search:
index=botsv3 earliest=0 frothlywebcode "*.txt"
Running the following search and reviewing the events, we can clearly see a REST.PUT.OBJECT request with a filename pertaining to this situation.
Question 7 answer:
OPEN_BUCKET_PLEASE_FIX.txt
Question 8 (206)
What is the size (in megabytes) of the .tar.gz file that was successfully uploaded into the S3 bucket while it was publicly accessible? Answer guidance: Round to two decimal places without the unit of measure. Use 1024 for the byte conversion. Use a period (not a comma) as the radix character.
We might get to use some Splunk functionality beyond stats here! First let’s find this file. I remember seeing some .tar.gz files in the results of the last question.
We know that the bucket became public at 2018-08-20T13:01:46Z, so any GZ files being uploaded past then are fair game.
Looking at the results from index=botsv3 earliest=0 frothlywebcode "*.tar.gz", we can see frothly_web_memcaced.tar.gz being referenced quite a bit from both uploads and downloads. However, we should focus on the uploads. Looking at the events with REST.PUT.OBJECT frothly_html_memcached.tar.gz in the event data and an HTTP status code of 200, we can expand those events and see that they have an object size field.
We need to convert those obejct_size fields from bytes to megabytes. Let’s do it the Splunk way.
1 KiB (kilobyte) is equal to 1024 bytes. 1 MiB (megabyte) is equal to 1024 kilobytes.
Side note: those terms can get confusing!
In SPL, we can solve this using eval and round():
index=botsv3 earliest=0 frothlywebcode "*.tar.gz" operation="REST.PUT.OBJECT" http_status=200
| table object_size
| eval mb=round(object_size/1024/1024,2)
I wasn’t sure which one was right, but one of them was!
Question 8 answer:
2.93
Question 9 (208)
A Frothly endpoint exhibits signs of coin mining activity. What is the name of the first process to reach 100 percent CPU processor utilization time from this activity on this endpoint? Answer guidance: Include any special characters/punctuation.
Yikes, this one might be too real for you IR folks out there. I immediately think about osquery again and the processes table, which include the system_time, user_time, and wall_time fields. If you’re unfamiliar with the difference between them, now’s a good time to learn!
Looking at the following search, we see 3 osquery query results that include the system_time field:
index=botsv3 earliest=0 sourcetype="osquery:results" system_time | stats count by name
The queries with osquery-monitoring in them only probably only pertain to the amount of CPU osquery is consuming on the host (as opposed to all processes), so lets stick with system_profile and sort by wall_time descending:
index=botsv3 earliest=0 sourcetype="osquery:results" name=system_profile
| table hostIdentifier, columns.system_time, columns.user_time, columns.wall_time
| sort - columns.wall_time`
mars.i-08e52f8b5a034012d obviously sticks out as an outlier here for using tons of wall_time.
However, it looks like this host didn’t always have a spiking CPU. Let’s narrow down the times when it did:
index=botsv3 earliest=0 sourcetype="osquery:results" name=system_profile i-08e52f8b5a034012d
| table _time, hostIdentifier, columns.system_time, columns.user_time, columns.wall_time
| sort - columns.wall_time
| where 'columns.wall_time' > 3
Let’s see if we can figure out what processes are running around those times:
index=botsv3 earliest=0 sourcetype="osquery:results" hostIdentifier=mars.i-08e52f8b5a034012d | stats count by name
We can see a query named pack_process-monitoring_proc_events with 60422 events - that seems promising!
So, at this point, I’m not going to lie, I went down a few rabbit holes and failed to find the correct answer.
I noticed there was a ps sourcetype that included the output from the ps -wweo_uname,pid,psr,pcpu,cputime,pmem,rsz,vsz,tty,s,etime,args commands, so I sorted that data by pcpu, but it was clear that the processes there weren’t crypto-mining related.
Working backwards from the answer, it turns out there is a PerfmonMk:Process sourcetype that contains the answer to this question. However, I think this was kind of a poorly designed question and I don’t actually agree with the answer at all.
Looking at the results of index=botsv3 earliest=0 sourcetype="PerfmonMk:Process" process_cpu_used_percent=100 | table _time, host, instance, process_cpu_used_percent | sort + _time, we can see that MicrosoftEdgeCP#2 is actually the first process to reach 100% CPU usage. How the contestant is supposed to know which of these processes was running a crypto-miner in the browser based on CPU usage is a bit beyond me. I think based on the data presented MicrosoftEdgeCP#2 should be the correct answer to this question.
I’m a little disappointed in this one, both in myself for missing the PerfmonMk:Process sourcetype, but also in the question/answer itself.
Question 9 answer:
chrome#5
Question 10 (209)
When a Frothly web server EC2 instance is launched via auto scaling, it performs automated configuration tasks after the instance starts. How many packages and dependent packages are installed by the cloud initialization script? Answer guidance: Provide the number of installed packages then number of dependent packages, comma separated without spaces.
When I think about the phrase:
performs automated configuration tasks after the instance starts
“cloud-init” immediately comes to mind.
It seems I might be on the right track as there is a cloud-init-output sourcetype. I know we’re looking for dependencies, and I’m delighted to see the following query return results:
index=botsv3 earliest=0 source=/var/log/cloud-init-output.log dependencies
Looking at a sample of the data, you can see the lines for packages and dependencies differ:
---> Package httpd.x86_64 0:2.2.34-1.16.amzn1 will be installed
--> Processing Dependency: httpd-tools = 2.2.34-1.16.amzn1 for package: httpd-2.2.34-1.16.amzn1.x86_64
--> Processing Dependency: apr-util-ldap for package: httpd-2.2.34-1.16.amzn1.x86_64
--> Processing Dependency: libaprutil-1.so.0()(64bit) for package: httpd-2.2.34-1.16.amzn1.x86_64
--> Processing Dependency: libapr-1.so.0()(64bit) for package: httpd-2.2.34-1.16.amzn1.x86_64
---> Package libmemcached.x86_64 0:1.0.16-5.8.amzn1 will be installed
---> Package memcached.x86_64 0:1.4.15-10.15.amzn1 will be installed
If we can count the lines that contain “Package $x will be installed” and “Processing Dependnecy”, we should be able to get our answer!
I know off the top of my head I can solve this with grep in a matter of minutes, but I want to challenge myself and do it the Splunk way.
index=botsv3 earliest=0 source=/var/log/cloud-init-output.log dependencies
| table _raw, host | rex max_match=0  field=_raw "(?<packages>(\-\-\-\>\sPackage))"
| rex max_match=0  field=_raw "(?<dependencies>(\-\-\>\sProcessing\sDependency))"
| table host, dependencies, packages
| stats count(dependencies), count(packages) by host
However, right after I finished doing this, I realized I did a whole lot of work for nothing (isn’t that always the case with CTFs?!).
I built this query to count the instances of --> Processing Dependency and ---> Package in a field, only to realize the line Install 7 Packages (+13 Dependent packages) exists in the text as well!
facepalm
Let’s just write a regex for this line:
index=botsv3 earliest=0 source=/var/log/cloud-init-output.log packages dependent | rex field=_raw "Install\s+(?<packages>[\d]+)\s+Packages\s+\(\+(?<dependencies>[\d]+)\sDependent\spackages\)" | table _raw, packages, dependencies
That gets us our answer!
Question 10 answer:
7,13
Share this post
Twitter
Facebook
Reddit
LinkedIn